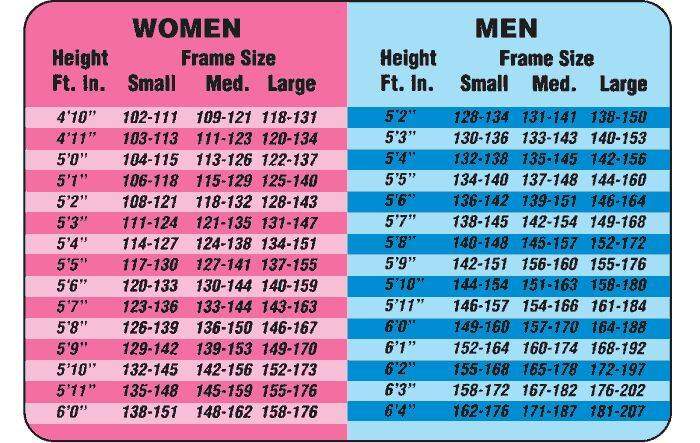
The determination of frame size
is covered earlier.
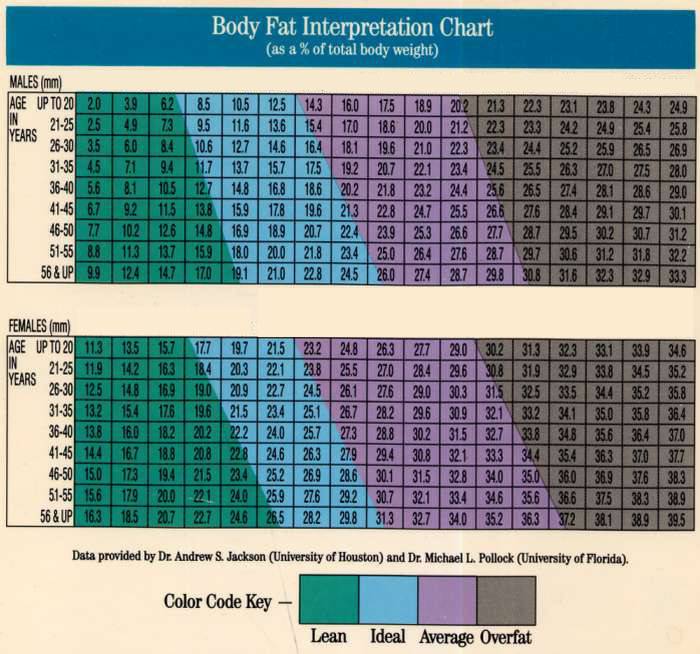
| This table shows healthy body fat
percentages. The first (green) zone is too lean. The second zone is ideal. The third zone is normal, while the final zone is obese. The numbers in the body of the chart represent body fat% calculated as a percent of total body weight. The number at the top in mm is a single skin fold caliper pinch, near the groin area. A single pinch, while adequate in many cases, can yield wildly inaccurate results. I present this chart solely for the zone markings. |

BACK